
COMPANY:
Promethean
Project Details
COMPANY
MY ROLES
Duration
STAKEHOLDERS
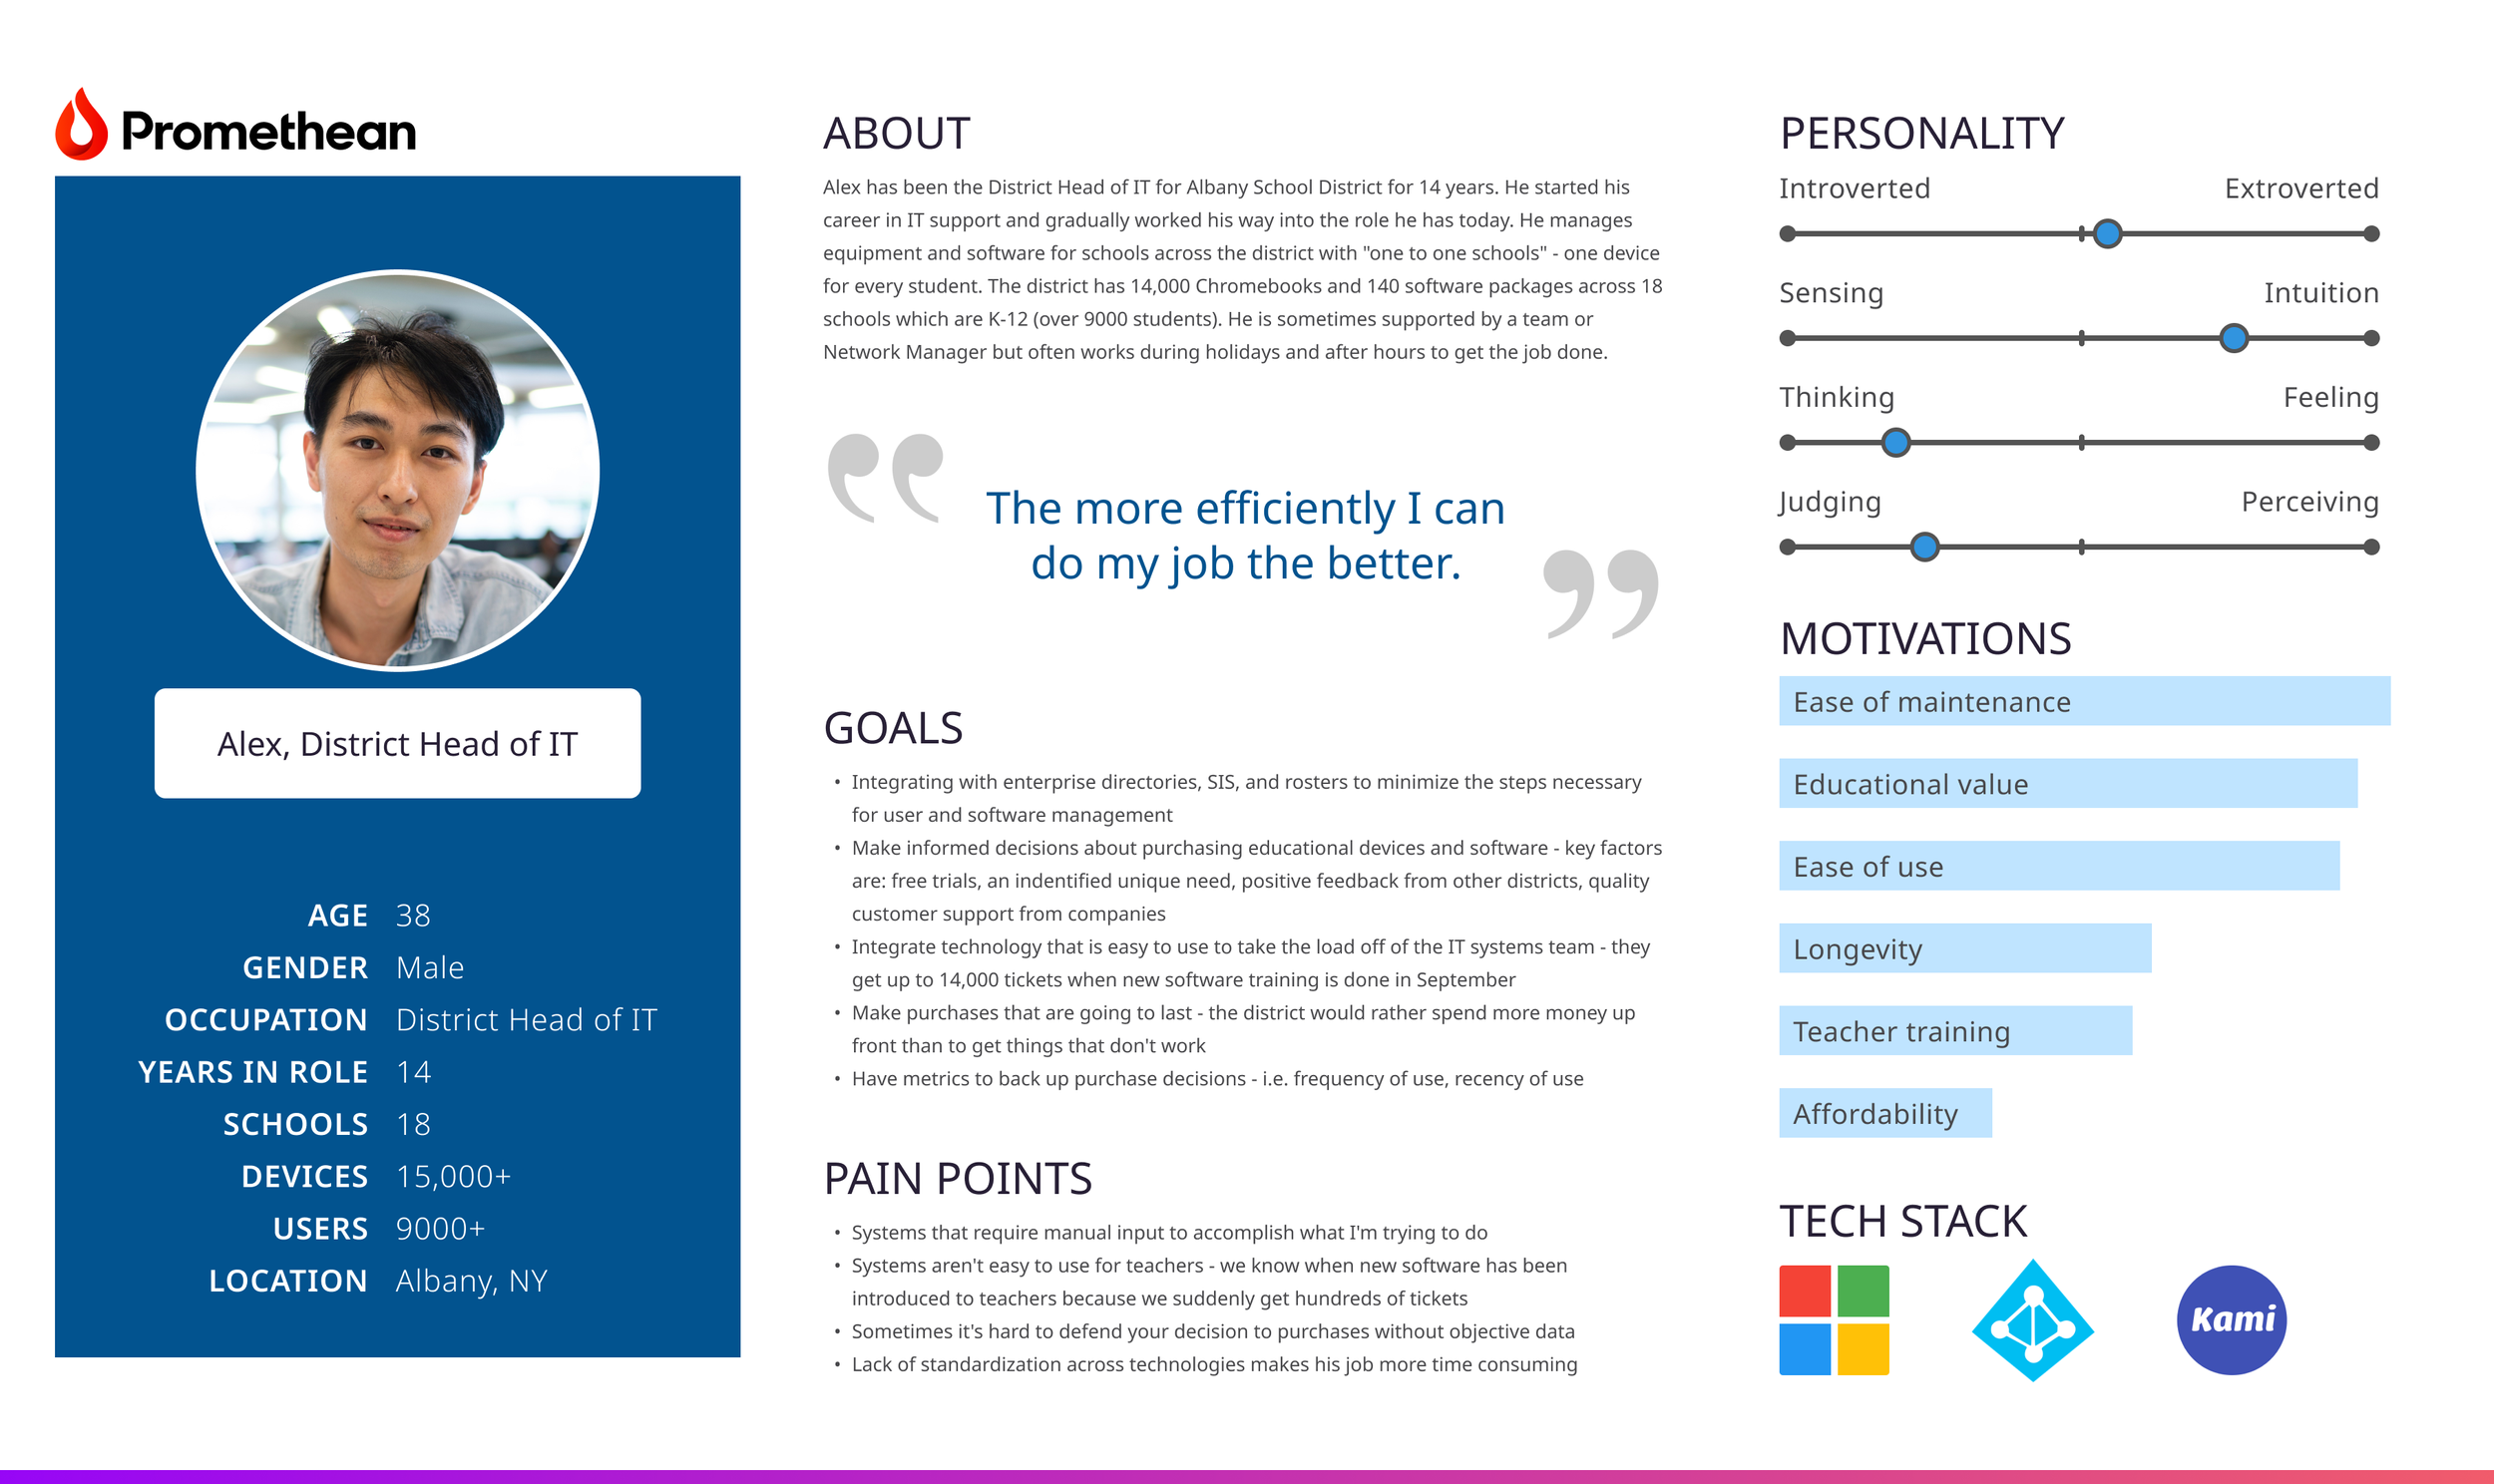
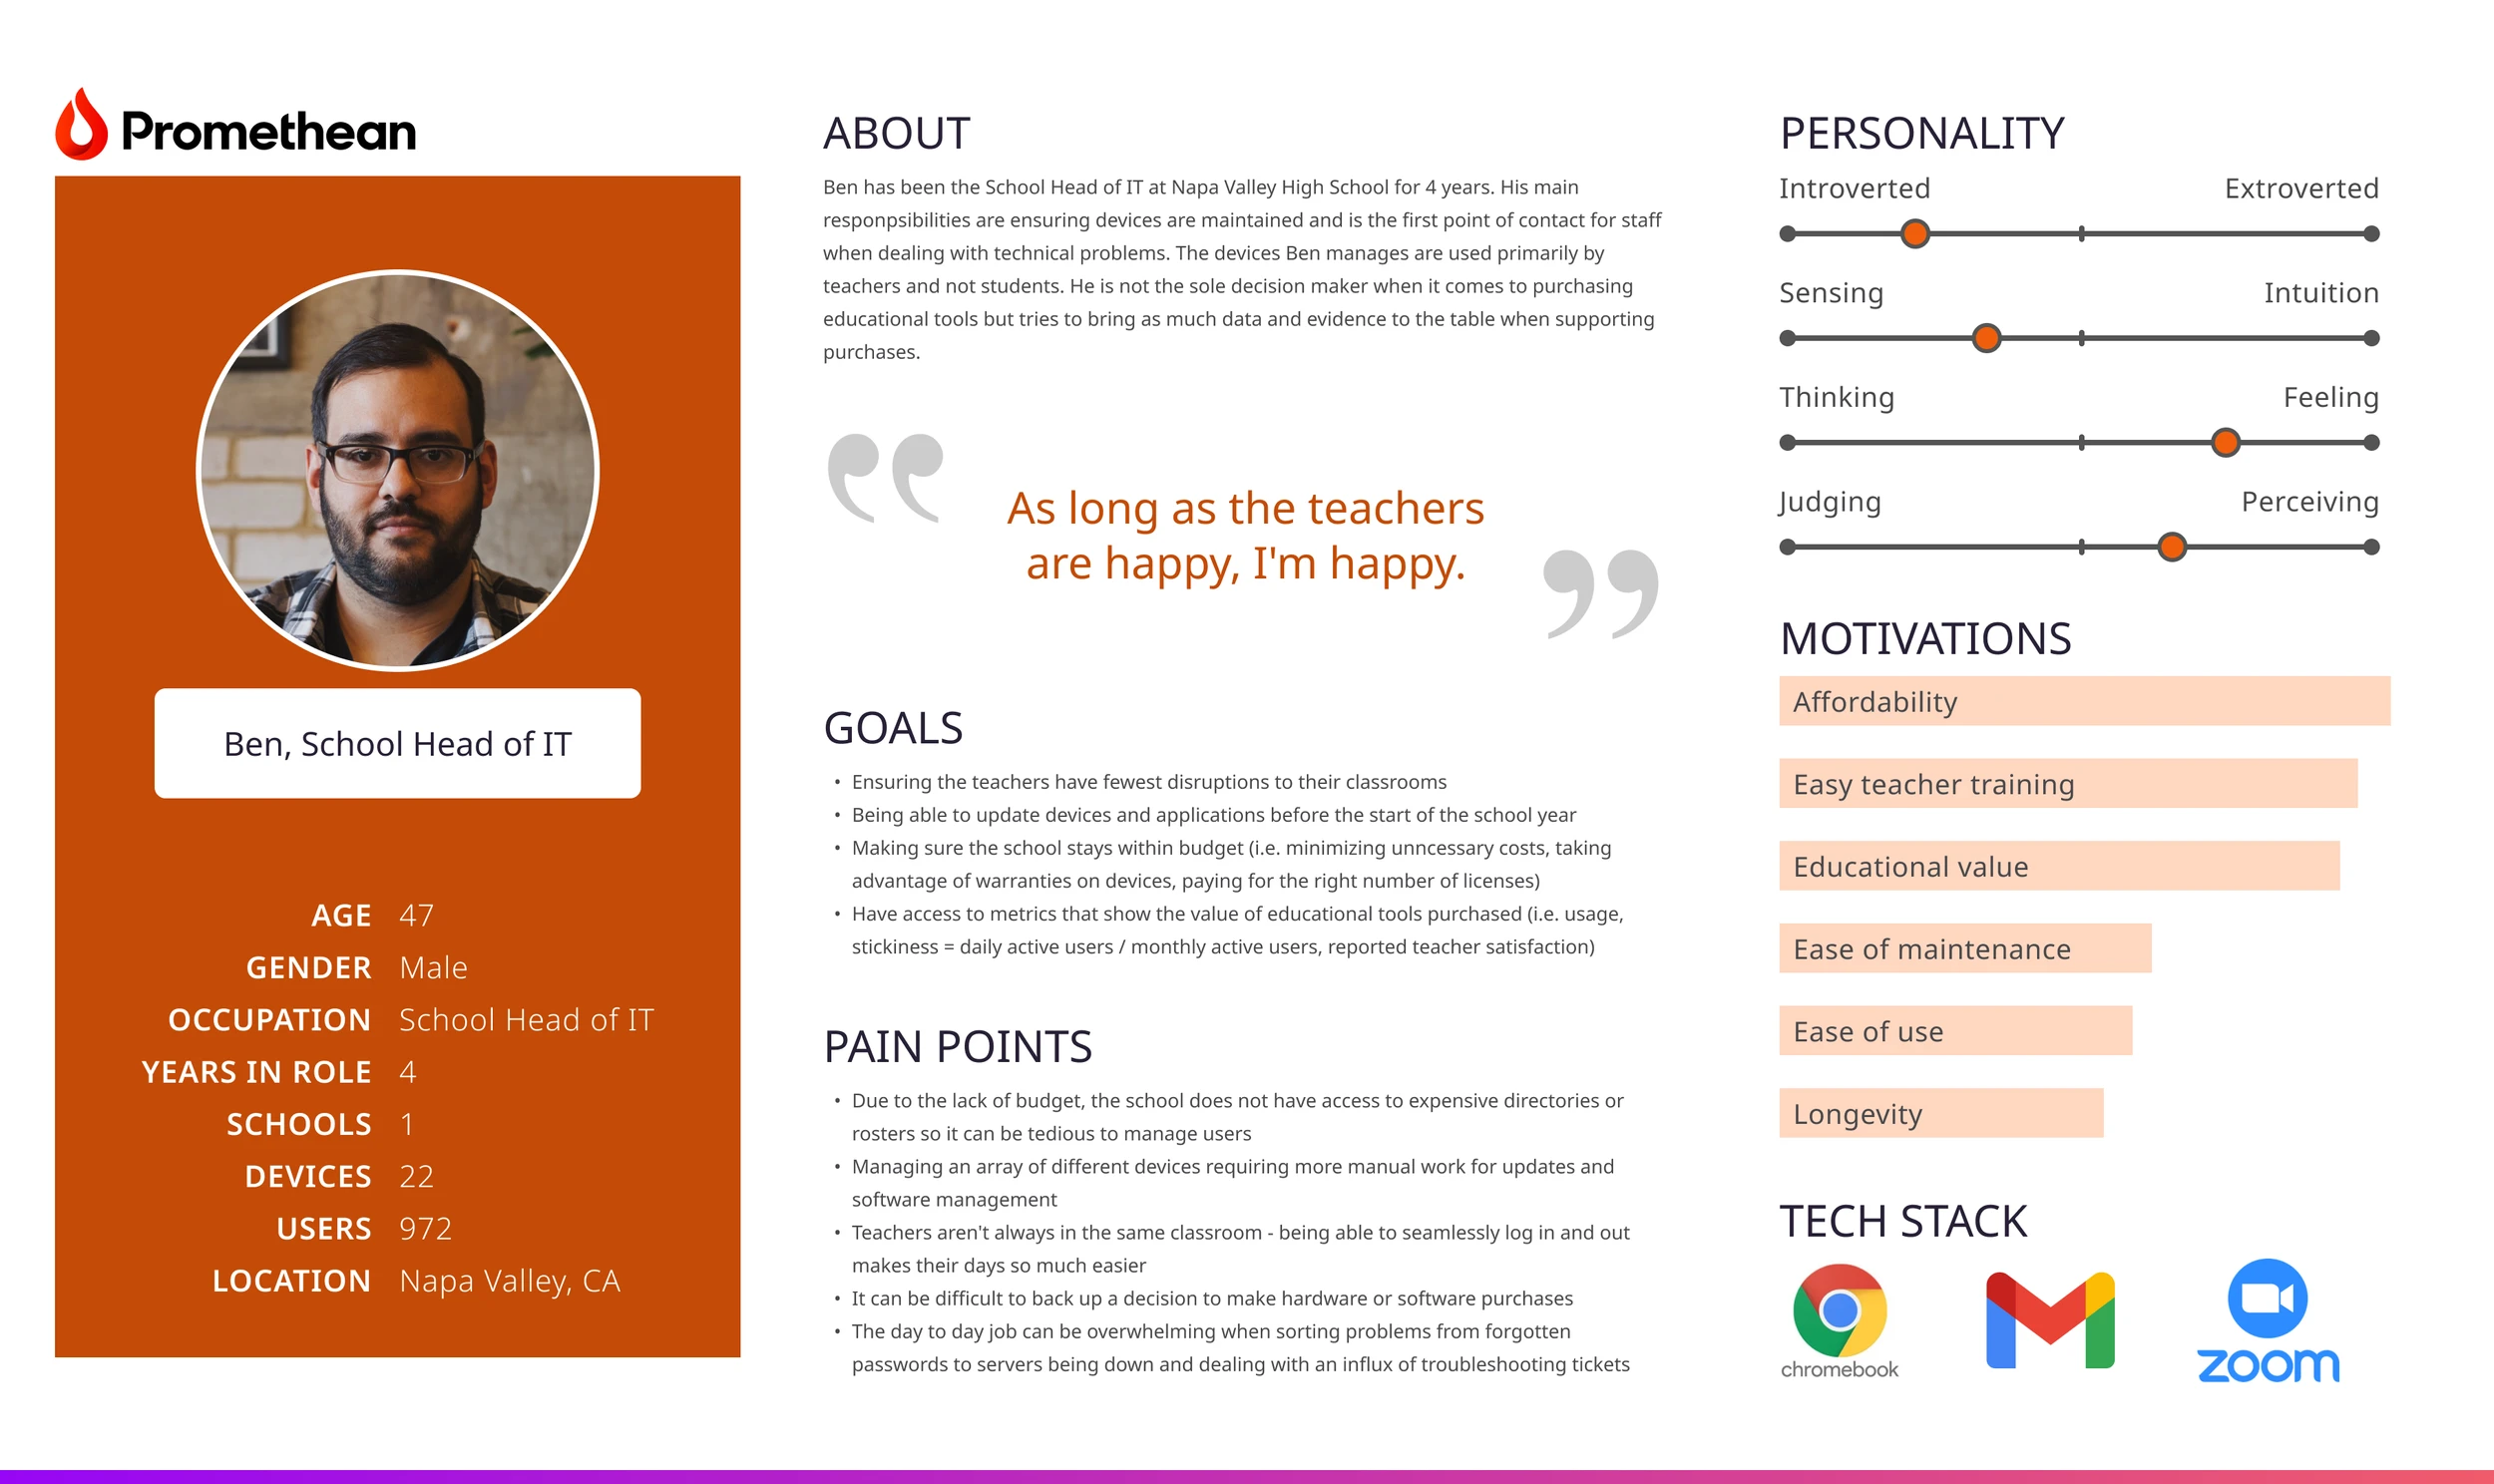
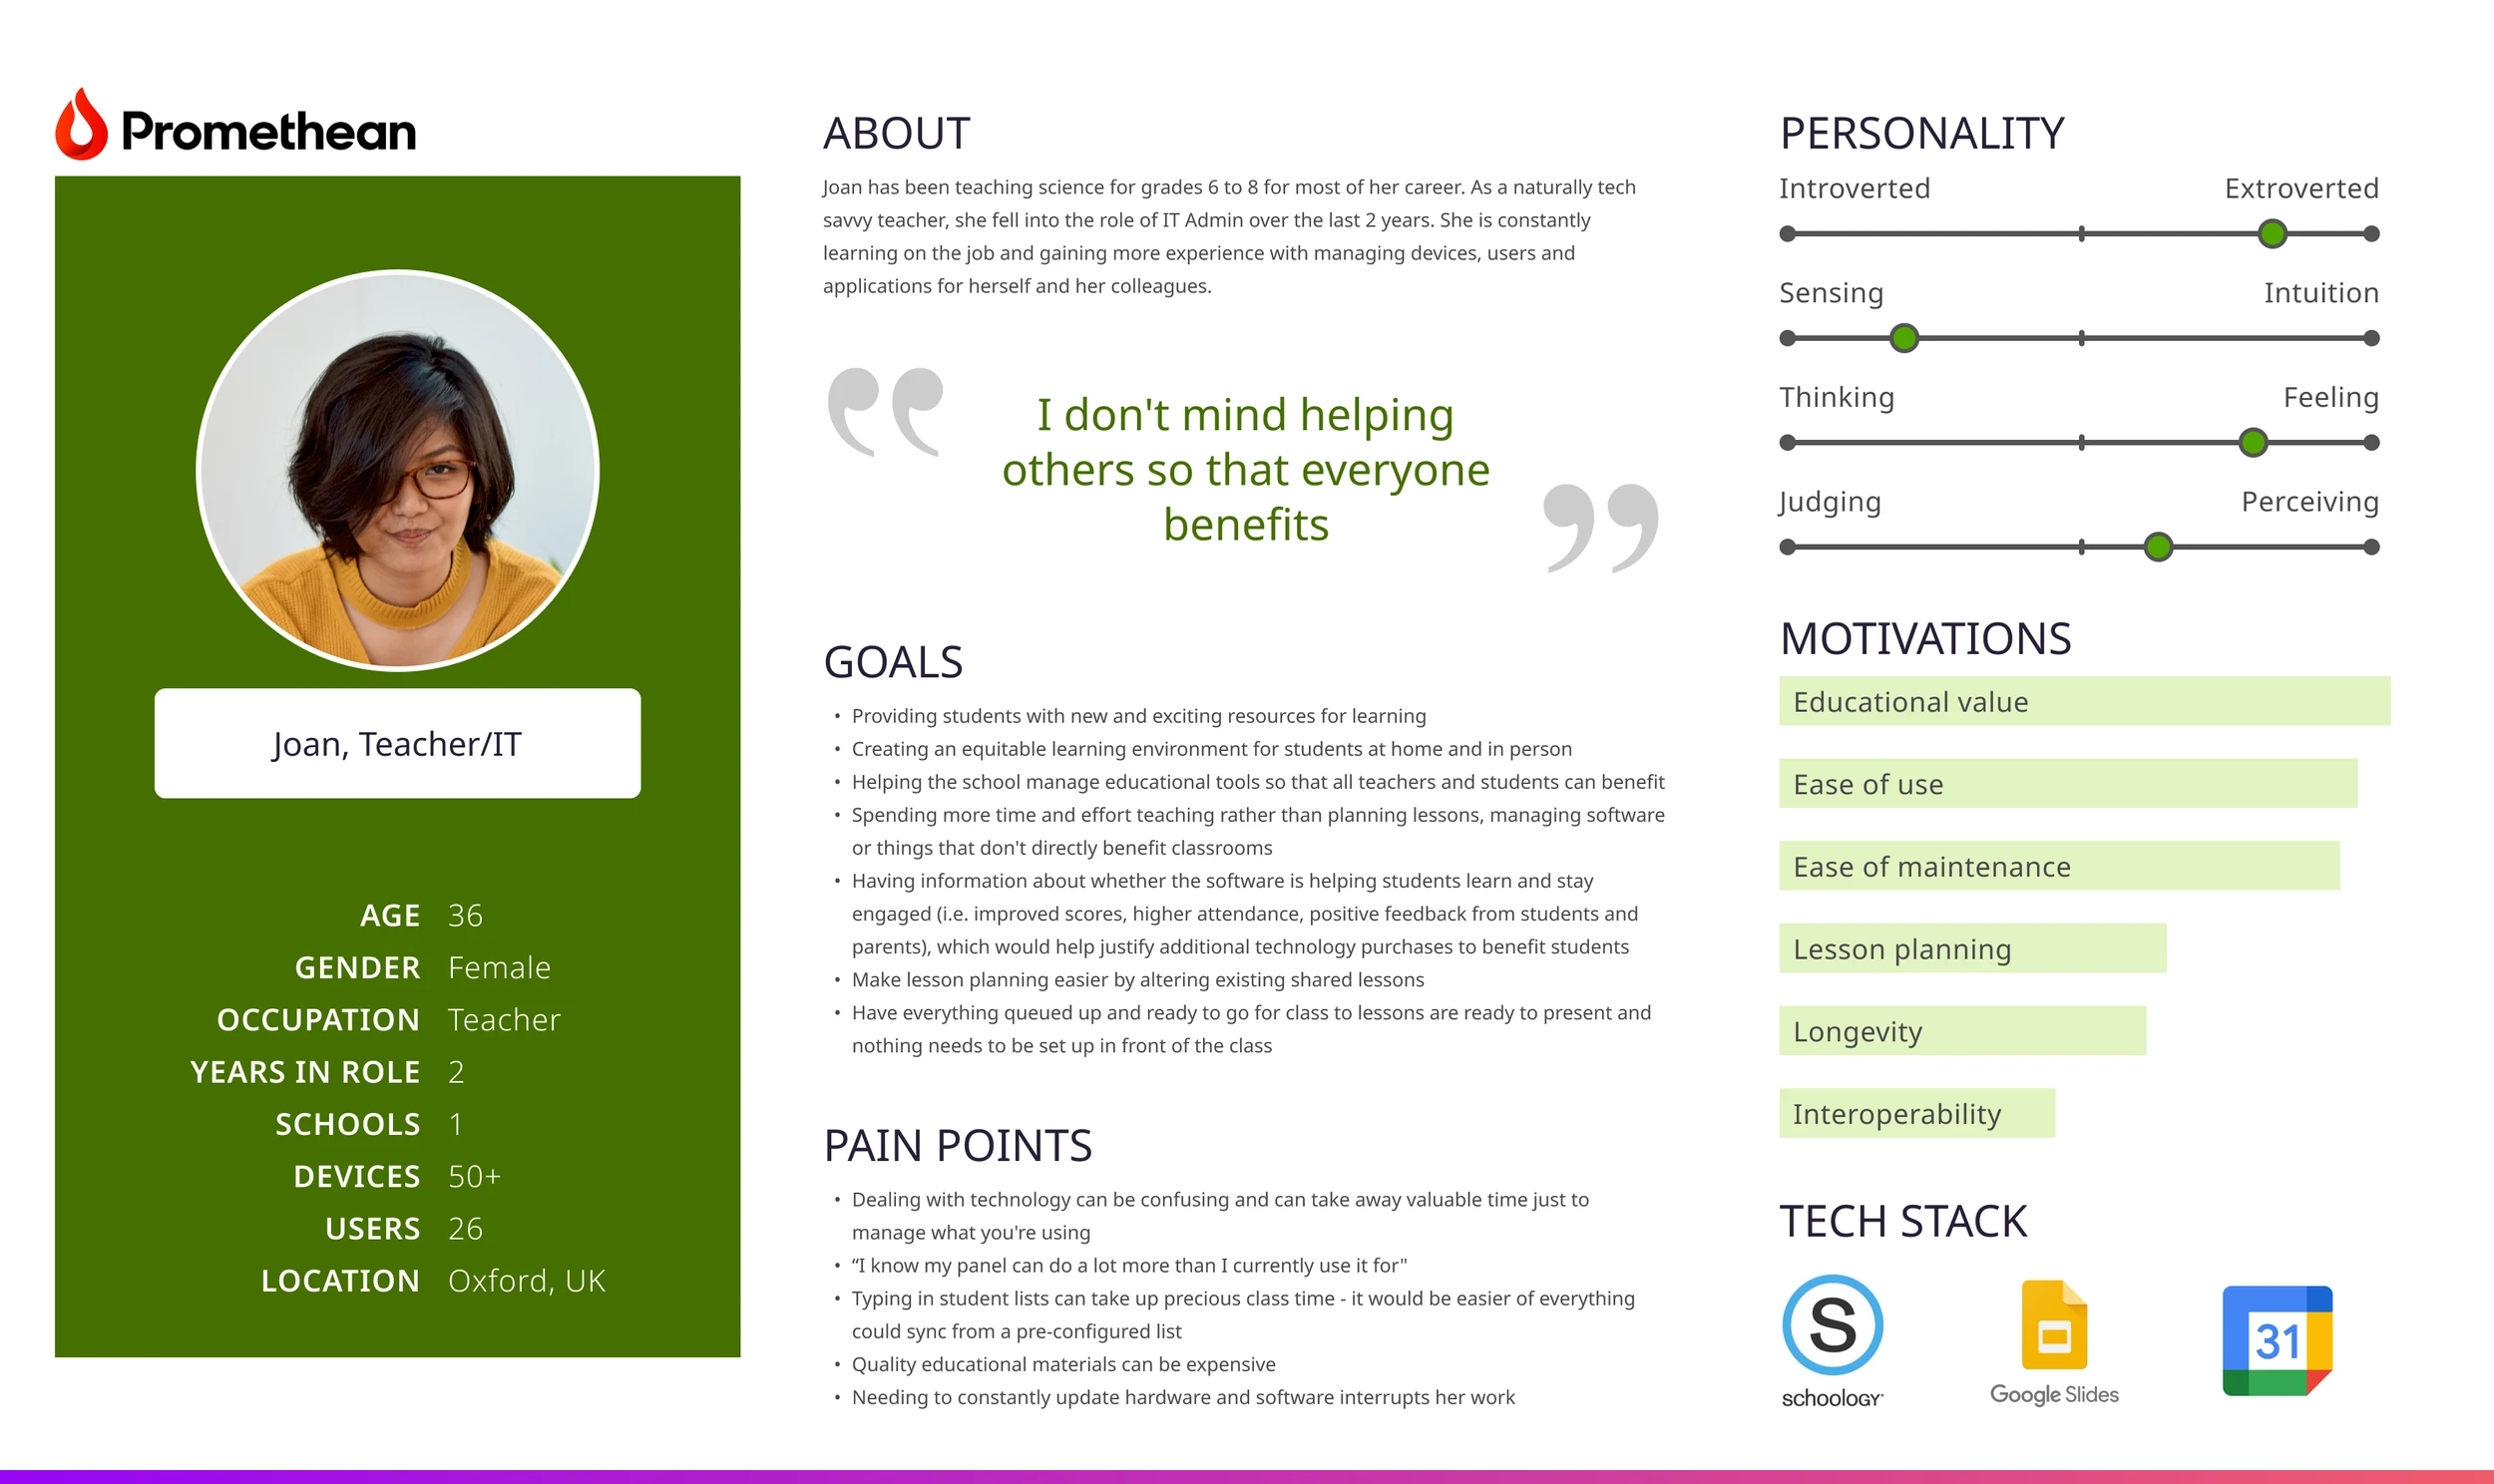
IT Admins manage a lot.
IT Admins working in education had enough on their plates.

They needed A simple way of visualizing complex data.
I conceptualized and designed a one-stop shop dashboard for IT Admins who had no available metrics or feedback when managing Promethean hardware, software and users.

Short on time?
UnderstandING the user.
What IT Admins needed:
Clear system status
Reliable information
Quick access to key actions
Efficient task management
Simple and accessible interface

The goal.
This needed to be more than a visually appealing dashboard.
Understandable data at a glance
Actionable items prioritized
Every element needed a clear purpose
Designed to make IT Admins’ jobs easier
WCAG AA accessibility required
Consistent with the company’s growing design system.
INFORMATION ARCHITECTURE.
Information architecture is the backbone of a robust IT admin dashboard. Before any UI elements or layouts were decided, I needed to answer the question: how should all this complex information be organized so IT Admins can understand and use it effectively? Some things I assessed were:
How do our users' mental models compare to our backend infrastructure? (i.e. roles, permissions, teams?)
How should data be organized most effectively?
What are the trade-offs?
I used closed-card sorting to help with this process. Why closed? We needed the dashboard to align with our established backend infrastructure.


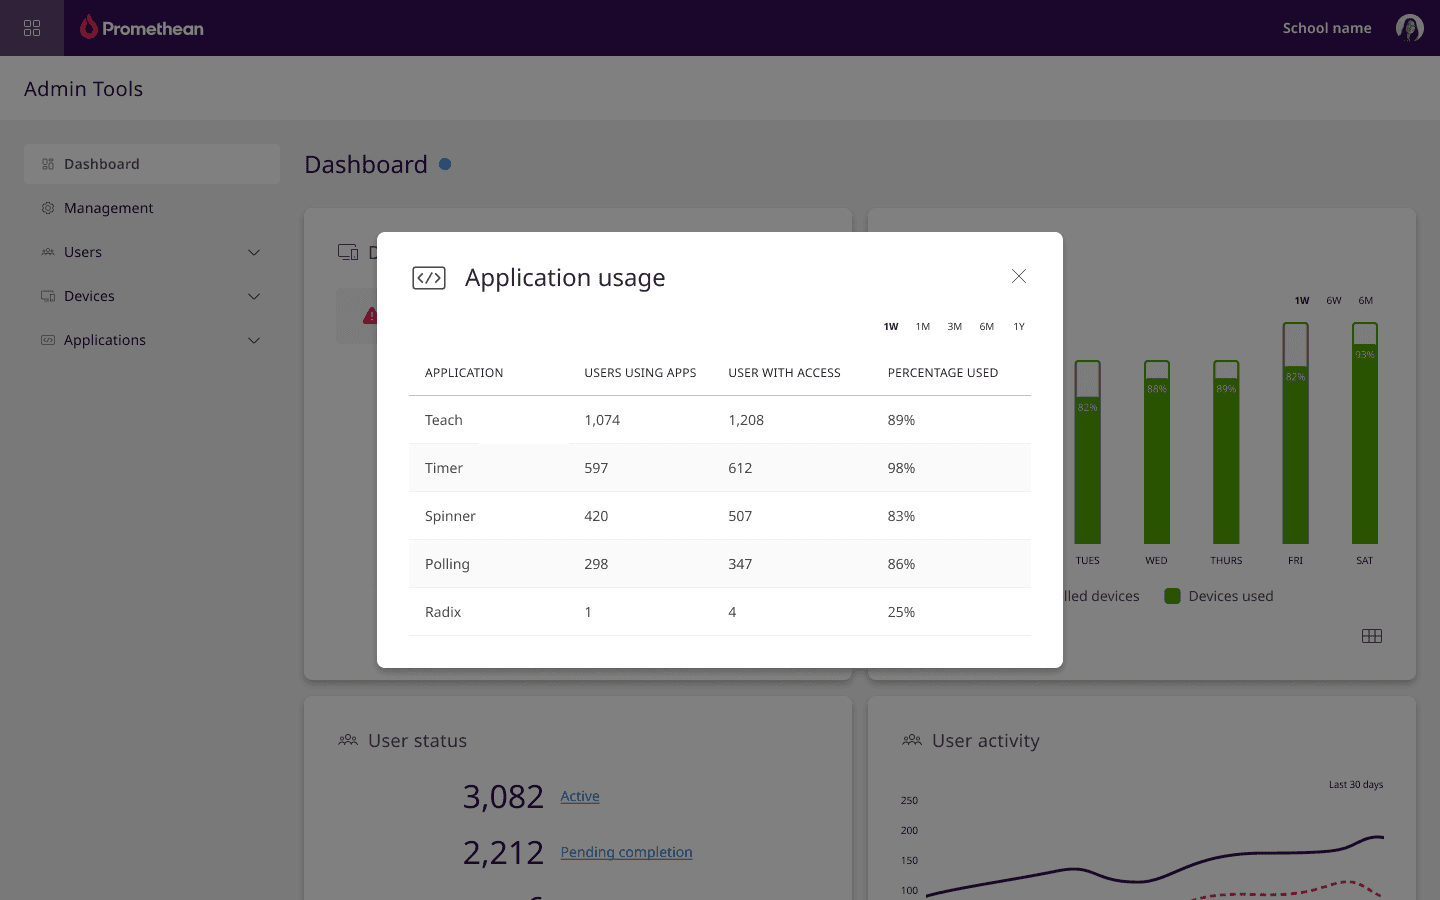

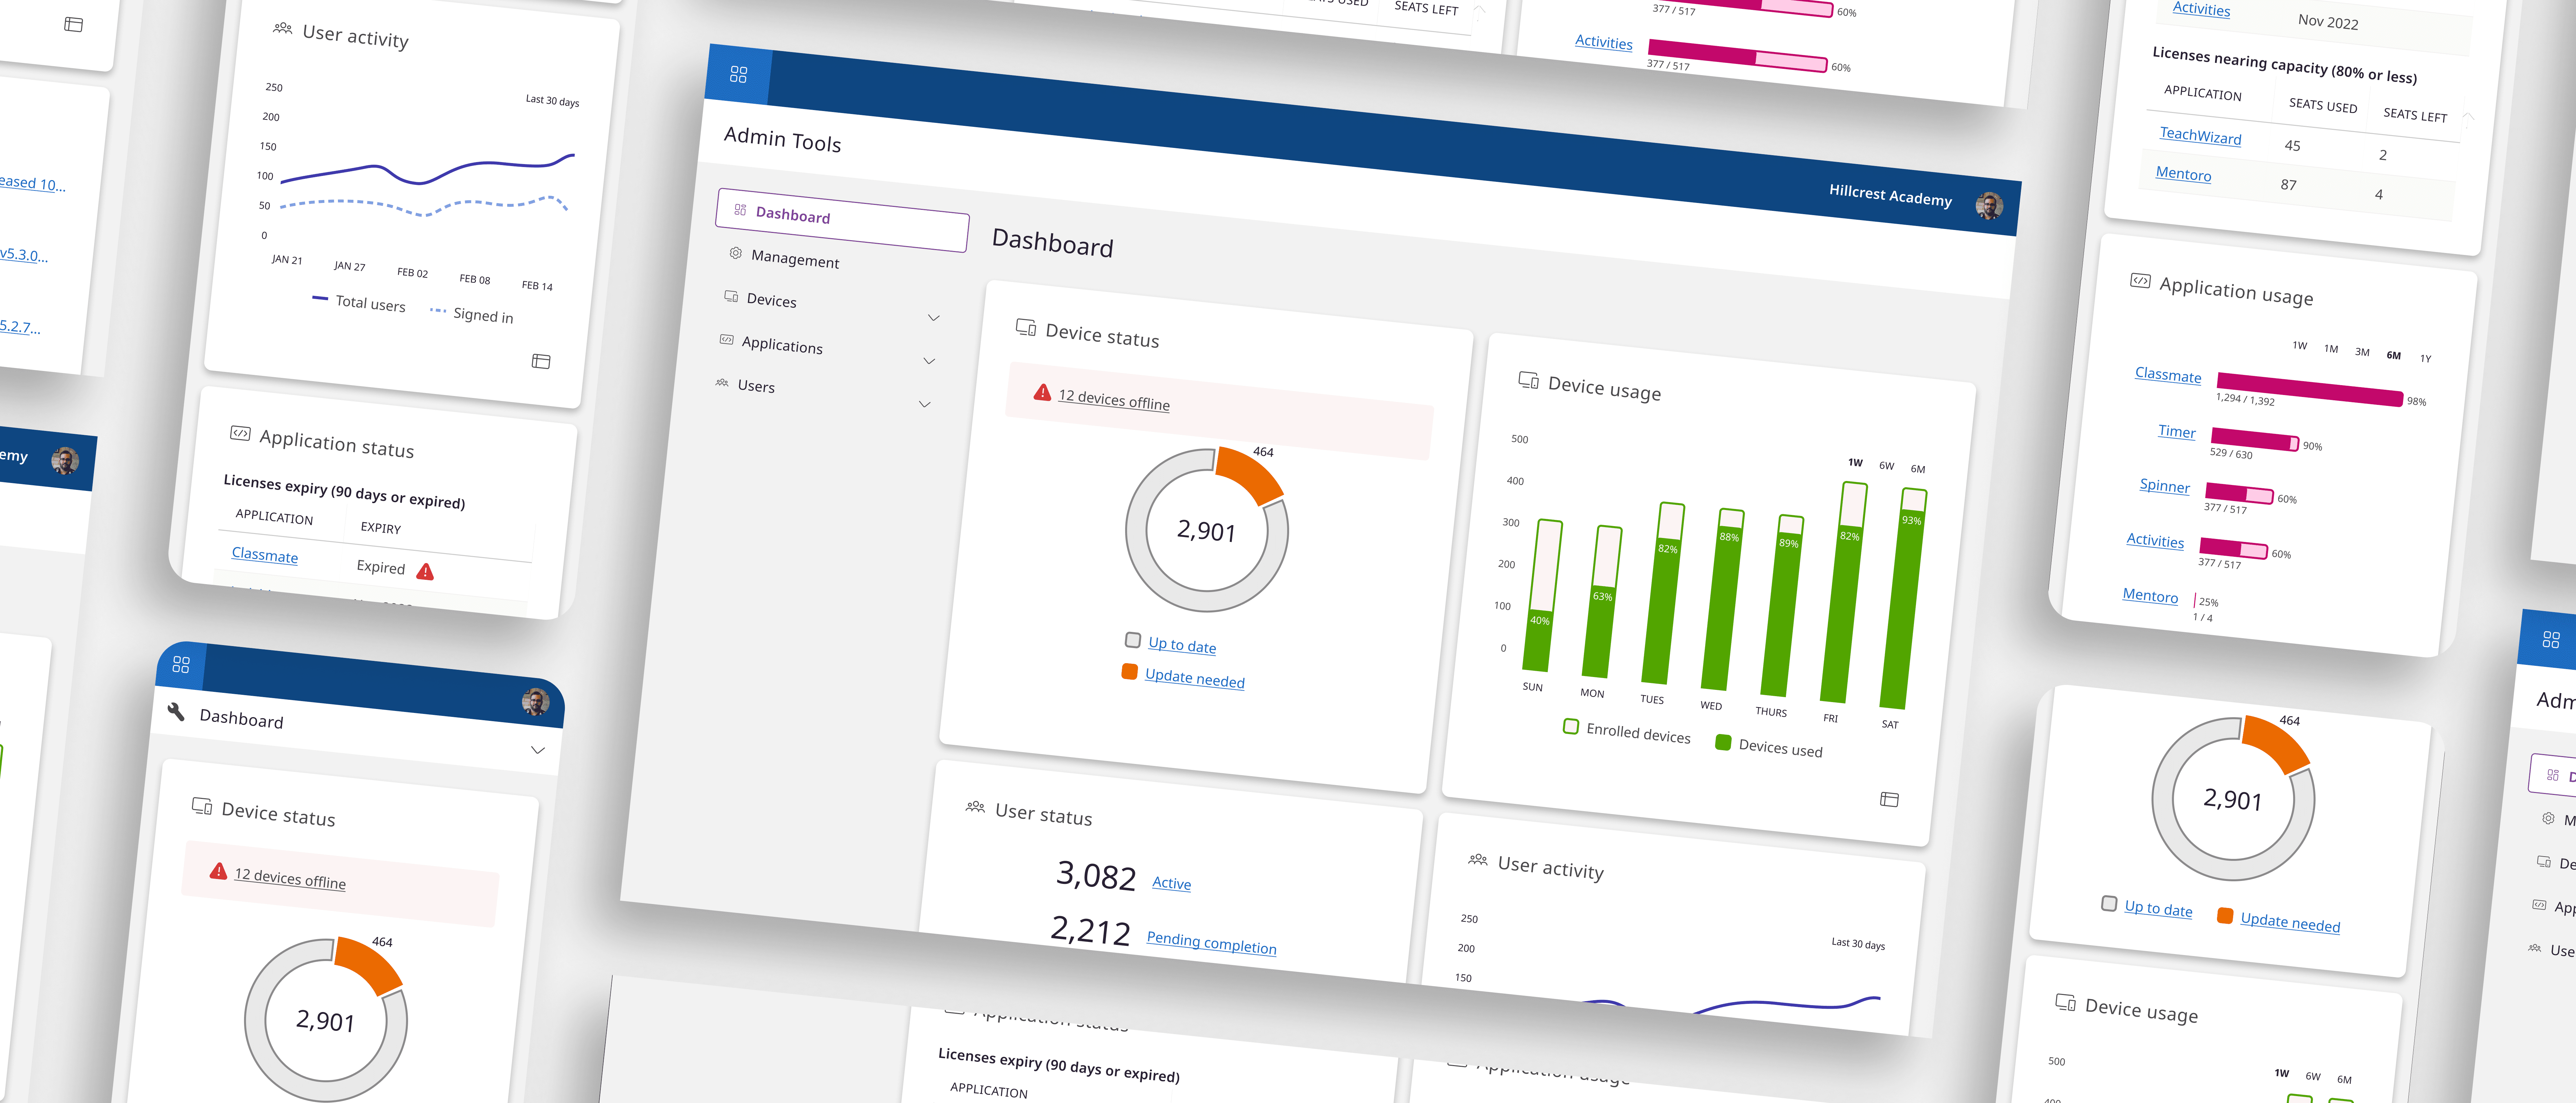

Everything, here all at once.
Information was organized in rows by status and activity, with actionable items placed at the top so IT Admins saw the most important insights first. From the dashboard, users could also navigate directly to key Admin Tools.

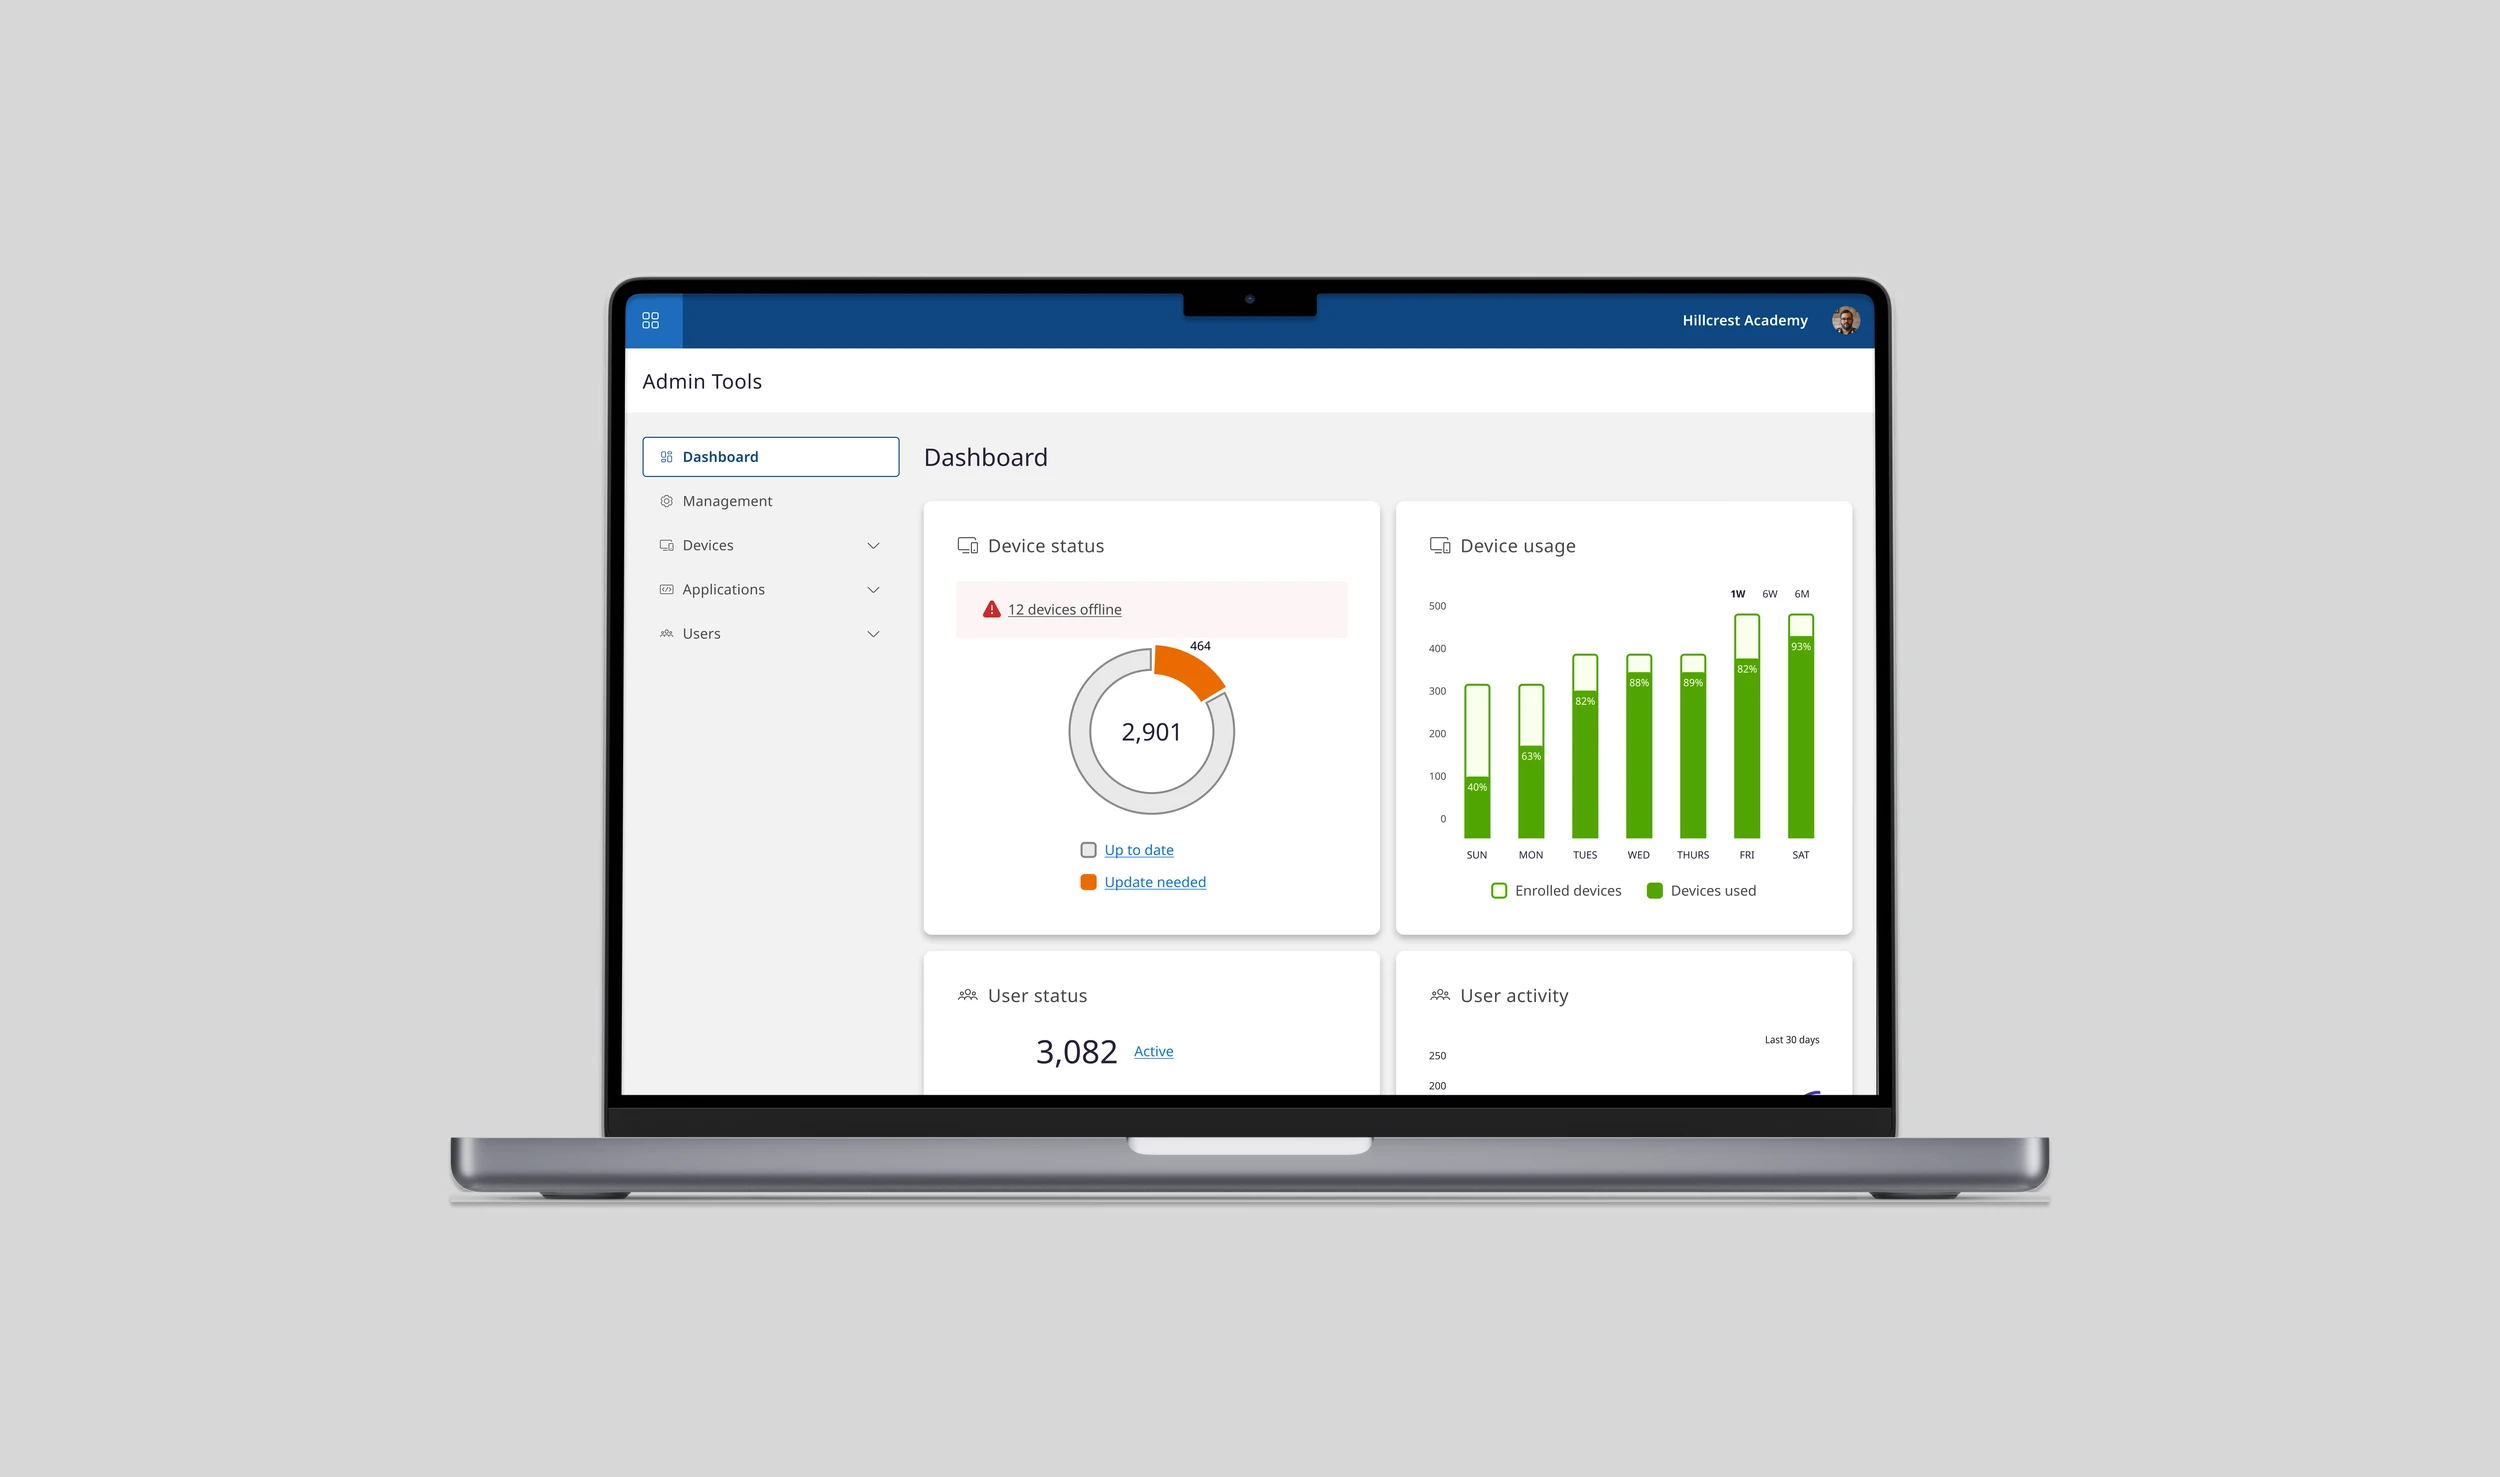
Fully Responsive.
Based on user research, IT Admins are often on site in classrooms and between schools dealing with technical problems. It was important to create a fully responsive experience for users who needed to access information on the go.
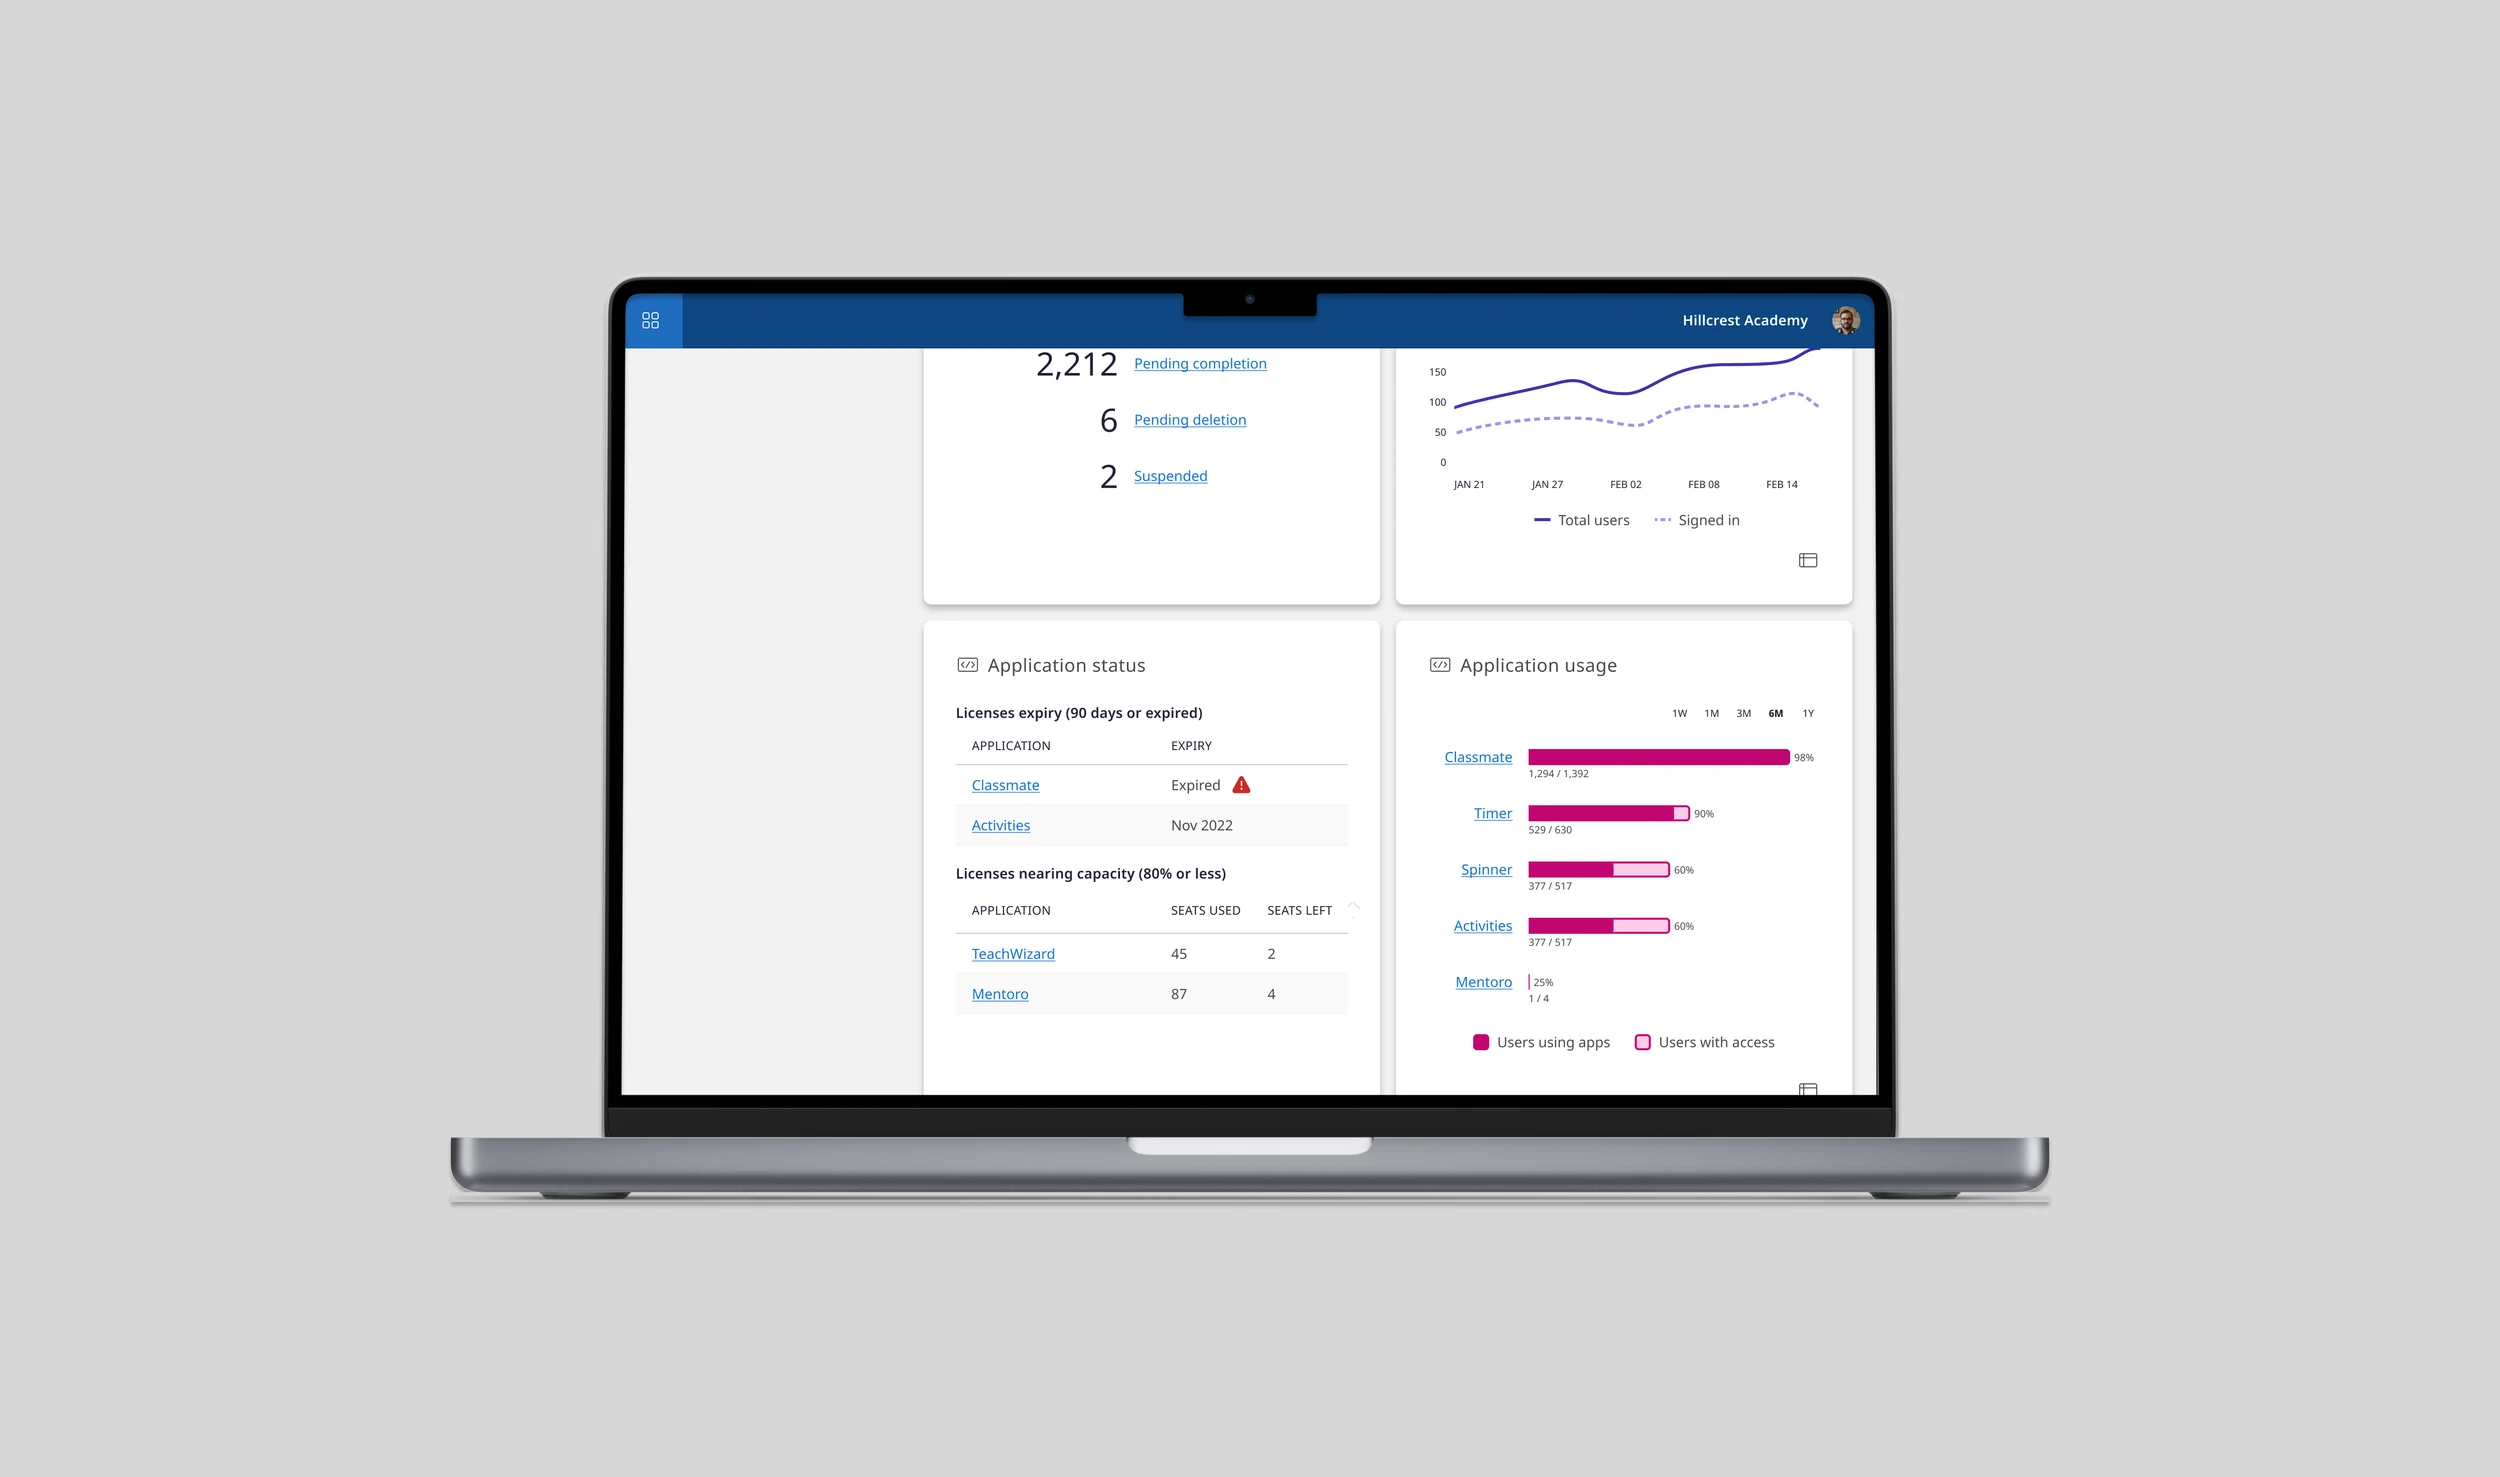
Reduced cognitive load.
Every element on the dashboard was purposeful and easy to interpret. We used role- and permission-based logic to ensure IT admins only saw information relevant to their responsibilities. Building on the existing design system, I applied distinct colour schemes to reduce cognitive load and make key insights easier to grasp at a glance.
/ 01
0/13
0/13

